October 2024 Market Update
Fall Back: October leaves markets in the red amid an otherwise upbeat year.
Key Observations
Despite a Federal Reserve rate cut in September, rising inflation concerns and a cooling labor market overshadowed optimism, leading to a cautious market environment in October.
While October brought challenges, year-to-date returns remain strong, highlighting underlying market resilience despite the month’s turbulence.
The path to normalized inflation may not be linear, strengthening the case for resilient portfolios in preparation for the road ahead.
Market Recap
As the leaves turned and October rolled in, financial markets felt a bit of uncertainty. Following the Federal Reserve's (“the Fed”) 50 basis-point rate cut in September, concerns of persistent inflation and a cooling labor market began to overshadow any optimism.
Across the globe, the economic picture appeared equally cloudy. Europe and parts of Asia grappled with softening growth projections, and geopolitical tensions continued to loom large, particularly impacting energy markets and trade dynamics. As supply chains stabilized from pandemic-era disruptions, the threat of renewed volatility remained, casting a long shadow over investor sentiment. All these factors combined to create a cautious atmosphere in the market, leading to a notable downturn in October, despite strong year-to-date gains.
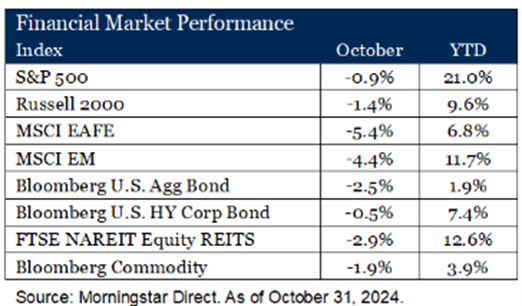
The S&P 500 fell by 0.9% in October, reflecting volatility in large-cap stocks amid mixed earnings and geopolitical tensions. Despite this, the index remains up 21.0% year-to-date, underscoring its resilience this year. Small-cap stocks (the Russell 2000 Index) saw a larger decline of 1.4% during the month. Rising borrowing costs and credit concerns weighed heavily on smaller companies, which are more sensitive to interest rate changes.
The MSCI EAFE Index, which tracks developed markets outside the U.S. and Canada, tumbled 5.4% as economic growth concerns in Europe and Asia weighed on investor confidence. Emerging markets, represented by the MSCI EM Index, weren’t spared either, falling 4.4% in October. Lingering inflation pressures and concerns over slowing growth impacted the index, though it remains up 11.7% YTD.
Bond markets struggled amid rising interest rates. The Bloomberg U.S. Aggregate Bond Index posted a 2.5% decline in October, but remains in positive territory year-to-date (+1.9%). Yields rose on concerns of persistent inflation amid strong economic data. High-yield bonds, represented by the Bloomberg U.S. High Yield Corporate Bond Index, fared better than the broader fixed income market due to it’s lower interest rate sensitivity and higher coupon profile, returning -0.5%. This sector remains up 7.4% year-to-date, as investors sought income in riskier assets despite some jitters in credit markets.
The FTSE NAREIT Equity REITs Index saw a 2.9% drop, pressured by higher interest rates that make borrowing more expensive and less attractive for property investments. However, the sector retains a positive 12.6% return YTD. Commodities were also down, with the Bloomberg Commodity Index declining 1.9% in October. Concerns about slowing global demand impacted energy and industrial metals, although the index remains positive for the year at 3.9%.
Rates Cut, Markets Split
At the end of September, the Fed enacted its first policy rate cut since March 2020, reducing the fed funds rate by 50 basis points. This decision came amid a robust economic landscape: U.S. GDP expanded at an annualized rate of 2.8% in Q3 2024, unemployment held steady at 4.1%, and inflation slowed for the sixth consecutive month, reaching 2.4% in September. The rate cut spurred mixed reactions across bond and equity markets, each offering a distinct view on the economy’s trajectory and inflation concerns.
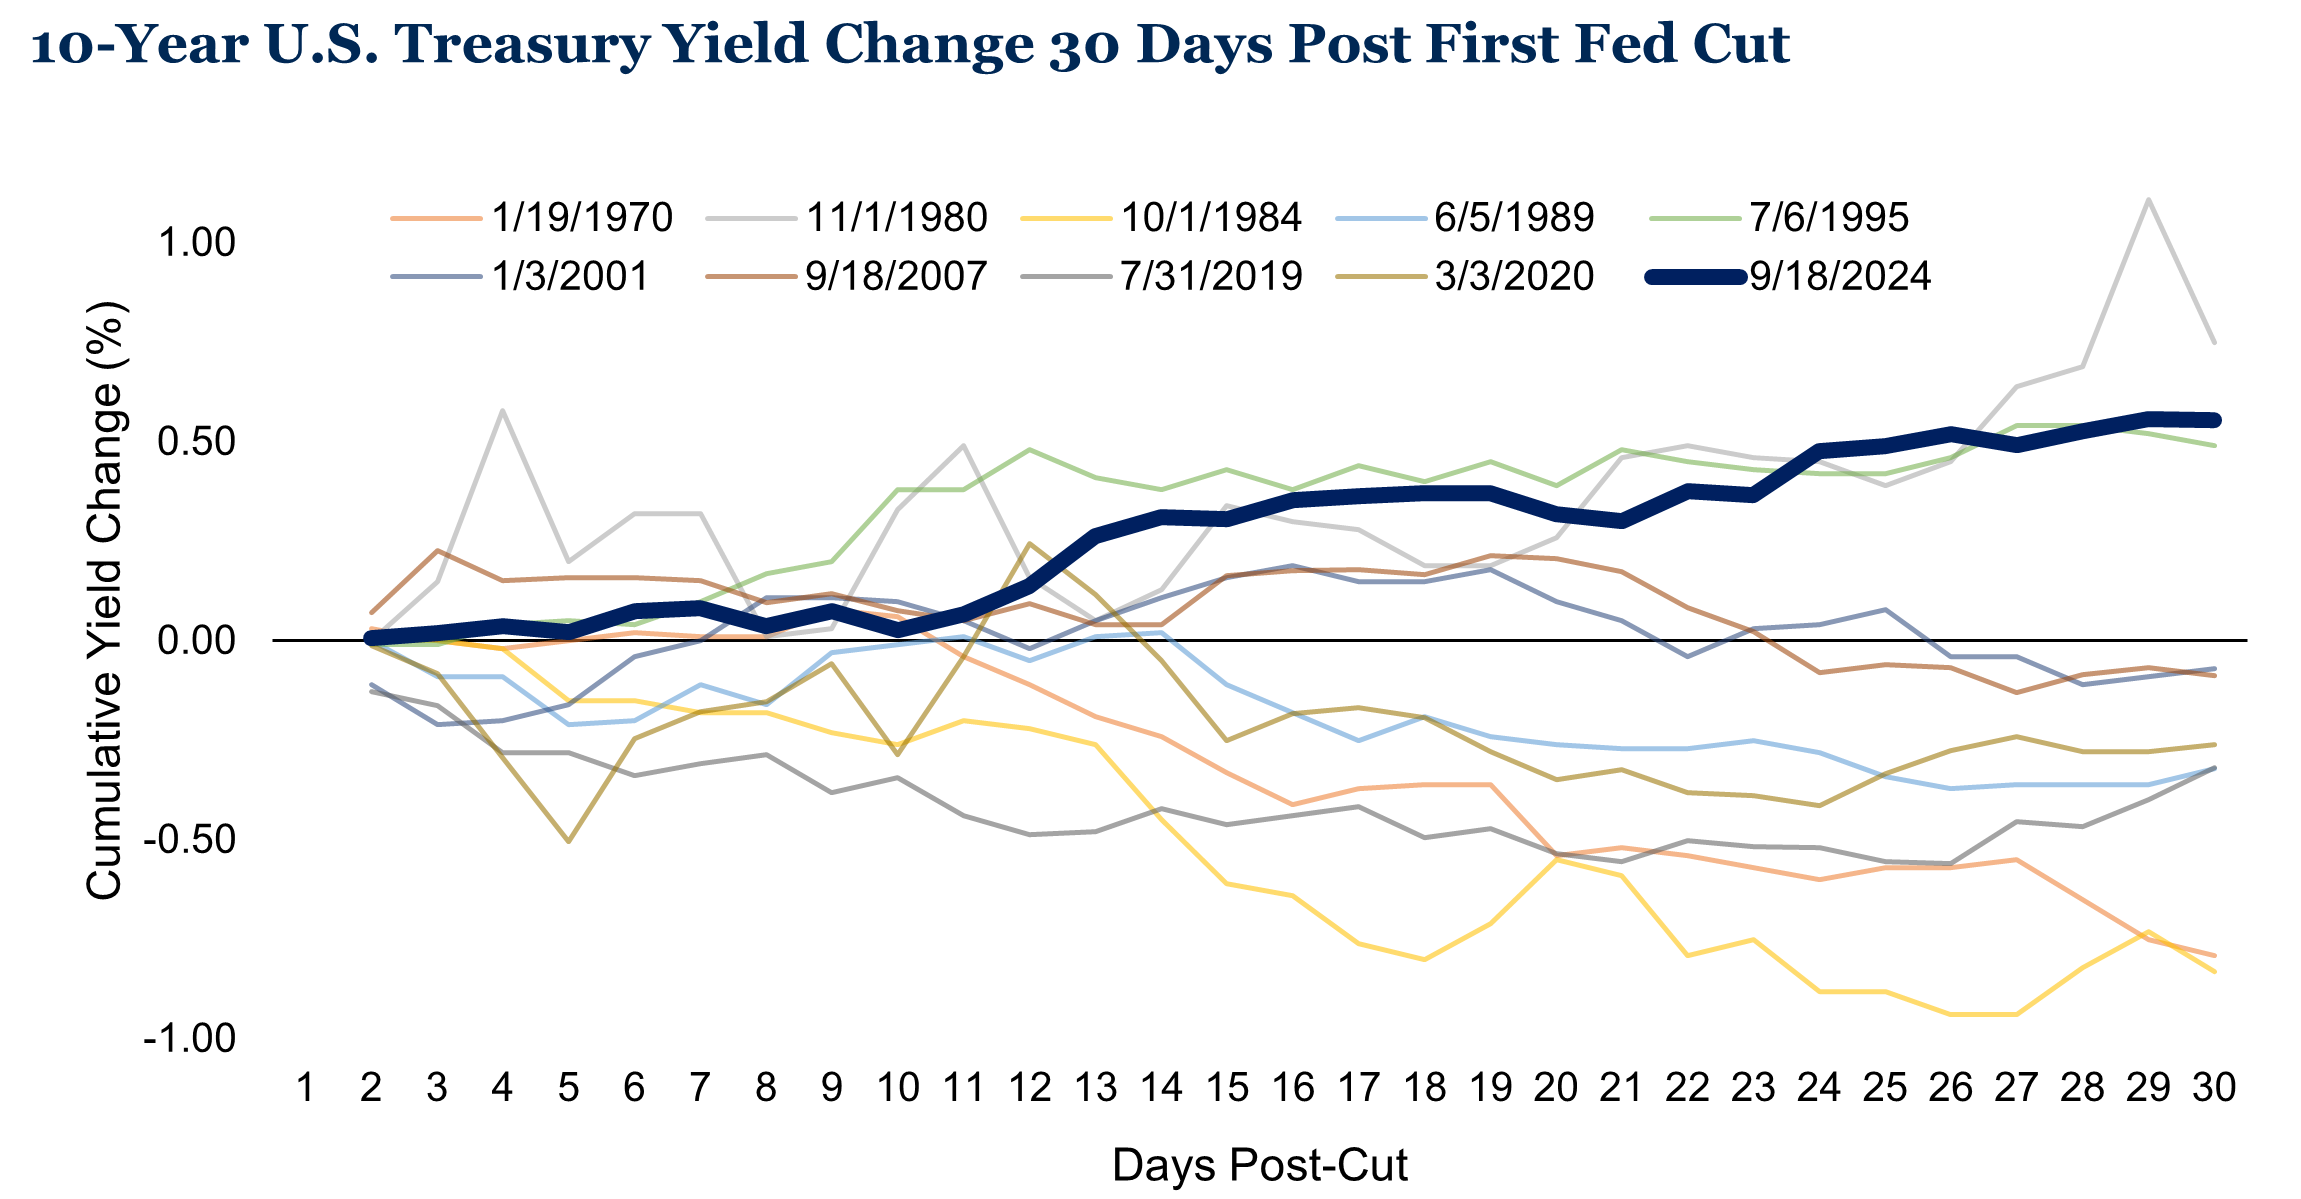
After the Fed’s move, the 10-year U.S. Treasury yield jumped more than 50 basis points, a signal that the bond market might be pushing back against the Fed's rate cut. It’s uncommon for bond markets to price rates higher following an initial rate cut; today’s increase marks the largest jump since the Fed’s 1995 cut.
Source: FactSet. As of October 31, 2024.
With rising yields, bond prices fell, suggesting that investors expect rates to remain elevated, likely due to ongoing inflation concerns and economic strength. In contrast, the S&P 500 recently reached all-time highs, driven by factors that diverge from the bond market’s cautious tone on the future direction for inflation.
Source: Factset. As of October 31, 2024.
Recent corporate earnings have remained resilient, with many companies sustaining profitability through pricing power, transferring some inflation pressures to consumers. Additionally, selective optimism in tech and AI has fostered a bullish sentiment in equities. The common theme is that these are inherently short-term views. Notably, the equity market has yet to fully price in the likelihood of resurging inflation impacting profit margins or of elevated rates affecting discount rates used in stock valuations.
Outlook
As we’ve discussed throughout the year, the journey toward normalized inflation is unlikely to be smooth. This current market dichotomy reflects a unique period where fixed income and equity investors are essentially wagering on different paths for inflation. We continue to believe that investors will face a challenging environment in balancing growth opportunities with rate-driven risks. Rather than speculate on future market moves, our focus remains on preparing portfolios for the road ahead through strategic asset allocation and diversified investments designed to be resilient over full market cycles.
Disclosures & Definitions
Comparisons to any indices referenced herein are for illustrative purposes only and are not meant to imply that actual returns or volatility will be similar to the indices. Indices cannot be invested in directly. Unmanaged index returns assume reinvestment of any and all distributions and do not reflect our fees or expenses.
The S&P 500 is a capitalization-weighted index designed to measure performance of the broad domestic economy through changes in the aggregate market value of 500 stocks representing all major industries.
Nasdaq Composite Index includes all domestic and international common type stocks listed on the Nasdaq Stock Market.
The S&P 500 Equal Weight Index (EWI) is the equal-weight version of the widely-used S&P 500. The index includes the same constituents as the capitalization weighted S&P 500, but each company in the S&P 500 EWI is allocated a fixed weight - or 0.2% of the index total at each quarterly rebalance.
Russell 2000 consists of the 2,000 smallest U.S. companies in the Russell 3000 index.
MSCI EAFE is an equity index which captures large and mid-cap representation across Developed Markets countries around the world, excluding the U.S. and Canada. The index covers approximately 85% of the free float-adjusted market capitalization in each country.
MSCI Emerging Markets captures large and mid-cap representation across Emerging Markets countries. The index covers approximately 85% of the free-float adjusted market capitalization in each country.
Bloomberg U.S. Aggregate Index covers the U.S. investment grade fixed rate bond market, with index components for government and corporate securities, mortgage pass-through securities, and asset-backed securities.
Bloomberg U.S. Corporate High Yield Index covers the universe of fixed rate, non-investment grade debt. Eurobonds and debt issues from countries designated as emerging markets (sovereign rating of Baa1/BBB+/BBB+ and below using the middle of Moody’s, S&P, and Fitch) are excluded, but Canadian and global bonds (SEC registered) of issuers in non-EMG countries are included.
FTSE NAREIT Equity REITs Index contains all Equity REITs not designed as Timber REITs or Infrastructure REITs.
Bloomberg Commodity Index is calculated on an excess return basis and reflects commodity futures price movements. The index rebalances annually weighted 2/3 by trading volume and 1/3 by world production and weight-caps are applied at the commodity, sector and group level for diversification.
Material Risks
Fixed Income securities are subject to interest rate risks, the risk of default and liquidity risk. U.S. investors exposed to non-U.S. fixed income may also be subject to currency risk and fluctuations.
Cash may be subject to the loss of principal and over longer periods of time may lose purchasing power due to inflation.
Domestic Equity can be volatile. The rise or fall in prices take place for a number of reasons including, but not limited to changes to underlying company conditions, sector or industry factors, or other macro events. These may happen quickly and unpredictably.
International Equity can be volatile. The rise or fall in prices take place for a number of reasons including, but not limited to changes to underlying company conditions, sector or industry impacts, or other macro events. These may happen quickly and unpredictably. International equity allocations may also be impact by currency and/or country specific risks which may result in lower liquidity in some markets.
Real Assets can be volatile and may include asset segments that may have greater volatility than investment in traditional equity securities. Such volatility could be influenced by a myriad of factors including, but not limited to overall market volatility, changes in interest rates, political and regulatory developments, or other exogenous events like weather or natural disaster.
Private Real Estate involves higher risk and is suitable only for sophisticated investors. Real estate assets can be volatile and may include unique risks to the asset class like leverage and/or industry, sector or geographical concentration. Declines in real estate value may take place for a number of reasons including, but are not limited to economic conditions, change in condition of the underlying property or defaults by the borrow.


